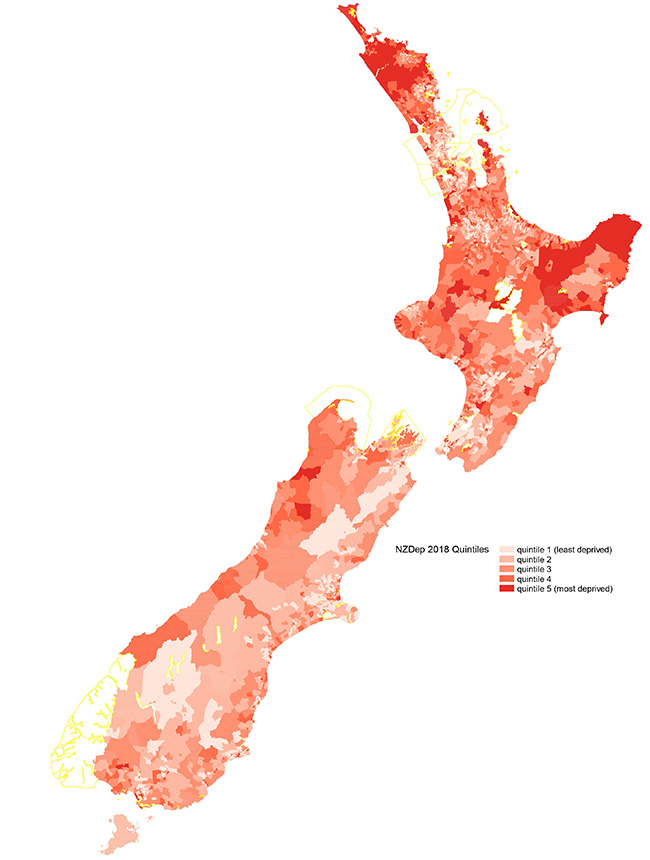
Damp and mouldy housing has been included as an indicator of socioeconomic deprivation in New Zealand by University of Otago researchers developing the latest version of the New Zealand Index of Socioeconomic Deprivation (NZDep2018).
The Index of Socioeconomic Deprivation is updated every five years using the latest census data as a means of detailing the distribution of socioeconomic deprivation throughout New Zealand. It is used as a basis for resource allocation formulas, such as the funding formula for District Health Boards, and various other government agencies, as well as community groups looking to advocate for extra resources, and for research, planning and needs assessment.
First developed in 1991, the latest version, NZDep2018, has recently been released.

Professor of Public Health Peter Crampton
Professor of Public Health Peter Crampton explains the country is divided into meshblocks, the smallest geographical units defined by Statistics New Zealand, which generally contain between 100 to 200 people. These small geographical areas, called Statistical Area 1, are used as the basis from which NZDep2018 was calculated.
“The scale of deprivation from 1 to 10 divides New Zealand into tenths, with a value of 10 indicating that the meshblock, or Statistical Area 1, is in the most deprived 10 per cent of all small areas in New Zealand, while a value of 1 indicates it is in the least deprived area.”
The deprivation scores apply to areas, rather than individual people.
Professor Crampton and his colleagues, June Atkinson from the University of Otago, Wellington, and biostatistician Clare Salmond, use a range of variables to measure deprivation in developing the index. These include factors such as employment, qualifications, income, home ownership and access to the internet.
Over time these variables have changed with the introduction of “living condition” in the latest version, taking into account people living in housing that is always damp and always has some mould (greater than A4 size).

NZDep 2018 Quintiles.
“The social meaning of variables changes over time. In the first version of the index, based on the 1991 census, the 'no phone' (ie, no land line) variable was important,” Professor Crampton explains.
“However, with the advent of widespread cell phone ownership this variable became redundant. But the importance of good housing and its impact on health is well recognised as a marker of poverty and has replaced the previously used 'access to a car' variable, which no longer is a strong deprivation characteristic.
“Living in a damp, mouldy house is equivalent to taking your children home where it is raining on the inside and this places you and your children at risk of respiratory diseases.”
Validation to confirm the usefulness of the indexes is important and smoking is a good example. The strong relationship between smoking and deprivation is mirrored in all the versions of the index since 1991, where the number of smokers is greatest in the most socioeconomically deprived areas (Dep 10) and lowest in the least deprived areas (Dep 1), though the rates of smoking have declined in each NZDep decile over the past five years.
The NZDep scales (from 1 to 10) have been constructed so they can be readily used in a variety of contexts and are easily presented graphically. However, this simplicity should not be allowed to obscure the underlying complexity of construction.
Professor Crampton cautions using the NZ Deprivation Index as a measure of change in deprivation across New Zealand over time.
“NZDep measures relative, not absolute socioeconomic deprivation. The index ranks all small areas in New Zealand according to how they compare with one another in terms of poverty. Therefore, with caution, comparisons of areas at a higher aggregation, such as territorial authorities, should be reasonable, although we advise caution in interpreting small changes over time as being practically meaningful. Comparing relationships between deprivation and another variable, over time, is reasonable.”
For further information, contact:
Professor Peter Crampton
Professor of Public Health,
Kohatu – Centre for Hauora Māori
Tel +64 3 479 8459
Email peter.crampton@otago.ac.nz
Liane Topham-Kindley
Senior Communications Adviser
Tel +64 3 479 9065
Mob +64 21 279 9065
Email liane.topham-kindley@otago.ac.nz
FIND an Otago Expert
Use our Media Expertise Database to find an Otago researcher for media comment.